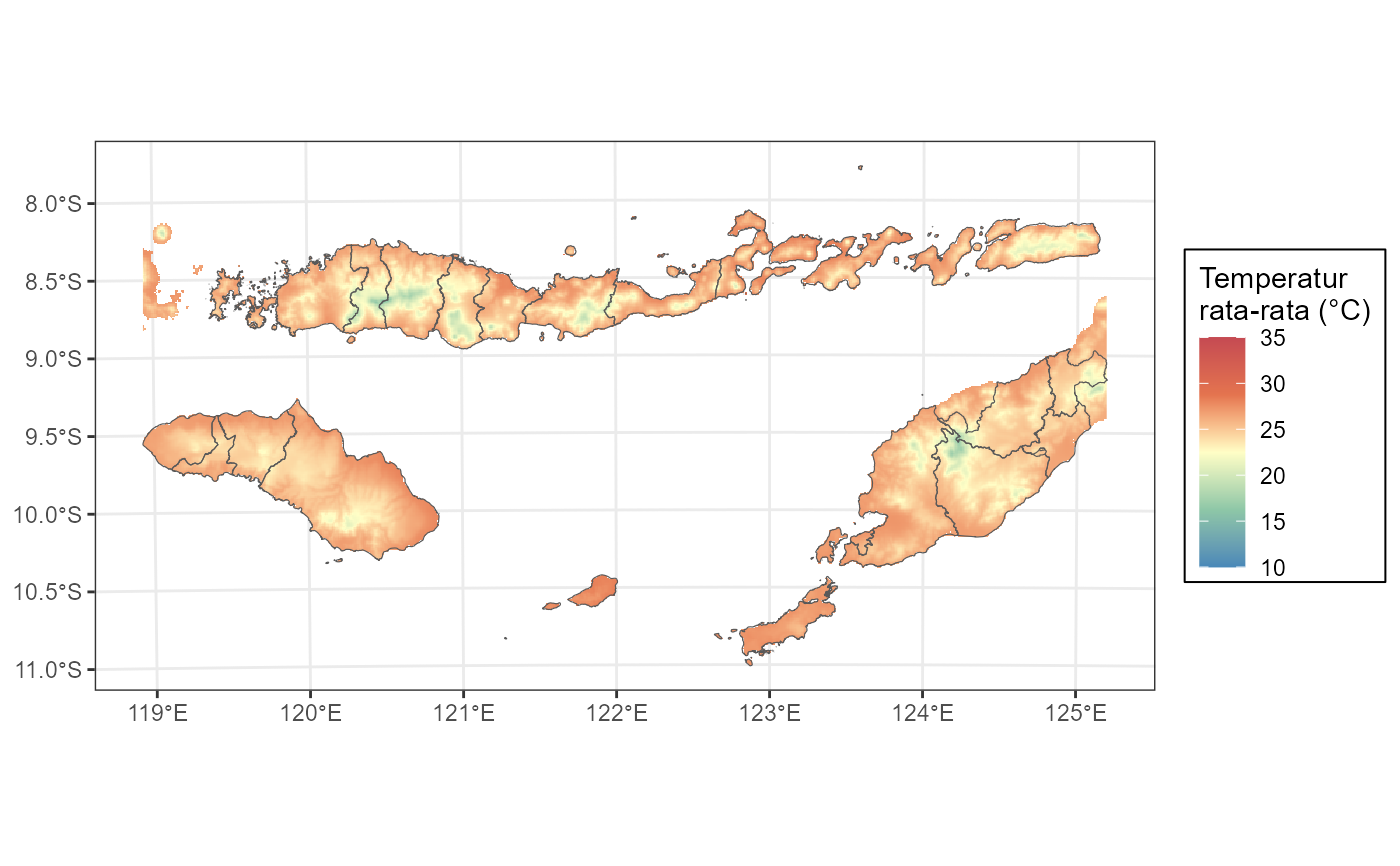
Visualize Temperature Map
vis_map_temperature.RdThis function generates a ggplot object that displays temperature raster data and boundary polygon data on a map. The color scale of the temperature data is customized and the legend is labeled in degrees Celsius.
Usage
vis_map_temperature(
  temperature_data,
  boundary_data,
  boundary_data_column = "Kabupaten",
  temp_limit = c(10, 35)
)
Arguments
- temperature_data
A spatial raster object that contains temperature data.
- boundary_data
A spatial polygon object that contains boundary data.
- boundary_data_column
column names relevant for mapping
- temp_limit
temperature range in degree celcius, default is c(10,35)
Examples
ntt_temp_path <- LUMENSR_example("ntt_temp.tif")
ntt_temp <-  terra::rast(ntt_temp_path)
vis_map_temperature(temperature_data = ntt_temp, boundary_data = ntt_admin)